- <GetStart>
- CSPro User's Guide
- The CSPro System
- Data Dictionary Module
- The CSPro Language
- Data Entry Module
- Batch Editing Applications
- Tabulation Applications
- Introduction to Tabulation
- Parts of a Table
- Parts of the Table Tree
- Common Uses of Tabulation
- Capabilities of Tabulation
- Cross Tabulations
- Tabulate Counts or Percents
- Tabulate Values and/or Weights
- Produce Summary Statistics
- Restrict a Universe
- Format Tables for Printing
- Load and Save Formatting Preferences
- Produce Tables by Area
- Save Tabulations in Different Formats
- Copy Table to Other Formats
- Copy and Paste Table Specification
- Create Multiple Subtables
- Change Unit of Tabulation
- Tally Items from Related Records
- Creating Tables
- Formatting Tables
- Creating Tables by Geographic Area
- Printing Tables
- Tabulation Preferences
- Saving and Copying Table Data
- Table Post Calculation
- Run Production Tabulations
- Advanced Table Topics
- Table Tips and Tricks
- Data Sources
- CSPro Statements and Functions
- Templated Reporting System
- HTML and JavaScript Integration
- Action Invoker
- Appendix
- <CSEntry>
- <CSBatch>
- <CSTab>
- <DataViewer>
- <TextView>
- <TblView>
- <CSFreq>
- <CSDeploy>
- <CSPack>
- <CSDiff>
- <CSConcat>
- <Excel2CSPro>
- <CSExport>
- <CSIndex>
- <CSReFmt>
- <CSSort>
- <ParadataConcat>
- <ParadataViewer>
- <CSCode>
- <CSDocument>
- <CSView>
- <CSWeb>
Cross Tabulations
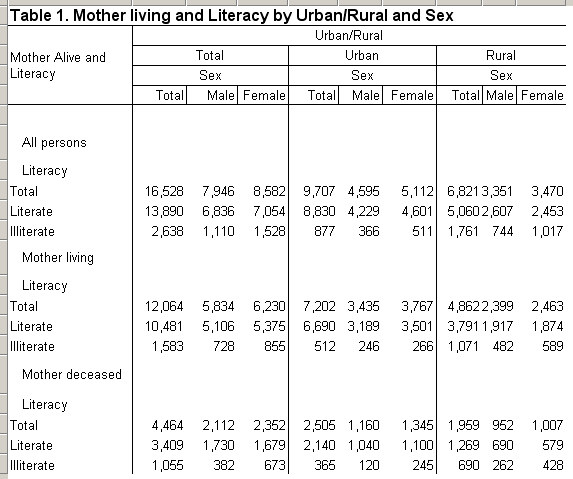
Cross tabulations can display relationships between two or more data items. You may have both dependent and independent variables in each dimension [row and column].

For example, this table has Urban/Rural and Mother Alive as independent variables; Sex and Literacy as dependent variables. In addition, this table could be produced by 'area'; usually this is a geographic item but it could be any item that meets certain conditions. The 'area' item is basically an extra tabulation variable.
The user can elect to display tabulations in terms of actual counts or as percentages of the total, and has the option of counting special and/or undefined values. The counts in tabulations may be unweighted or weighted. Users can produce a table on a subset of a file using the universe option, or select an item or numeric value to be used as a weighting factor during tabulation.
The selection of an item as a row or column variable will affect the table layout.
See also: Create a Table